Homeownership is the Key to Closing the Wealth Gap

Please read this article (original link here), and please let us know if you would like to join a coalition to support greater homeownership opportunity. Click here to get in touch.
Housing Gains Could Increase Black Wealth More than Half a Trillion Dollars by 2031
- The Black-white wealth gap has widened over the past decade-plus: The typical Black household currently has less than a quarter (23.3%) of the wealth of a typical white household, down from more than a third (34.6%) before the Great Recession.
- Housing disparities account for 38.4% (about $1.18 trillion) of the overall $3 trillion median Black-white wealth gap.
- If the typical Black-owned home was worth the same as the typical white-owned home, Black wealth would more than double (from $930 billion to $2.1 trillion).
Somewhat modest gains in Black homeownership and home values could help shrink the existing $3 trillion Black-white wealth gap — almost half of which (~$1.2 trillion) can be attributed to housing disparities — by hundreds of billions of dollars over the next decade.
If Black housing in America looked like white housing, with comparable homeownership and home values, Black wealth would be more than double what it currently is, according to a Zillow analysis. But instead of making progress toward closing the yawning gap, the persistent racial wealth gap in this country has only widened since the Great Recession.
According to the Federal Reserve’s Survey of Consumer Finances (SCF), the gap between white and Black wealth stands at around $3 trillion in aggregate (Black $930 billion, white-equivalent $4 trillion), about $174,000 per typical household. This is larger than the gap has been for most of the past few decades, and in inflation-adjusted terms is on par with the late 1980s. The typical Black household has only about 23.3% of the wealth of a typical white household, down from 34.6% before the Great Recession.
Generating Wealth at Home
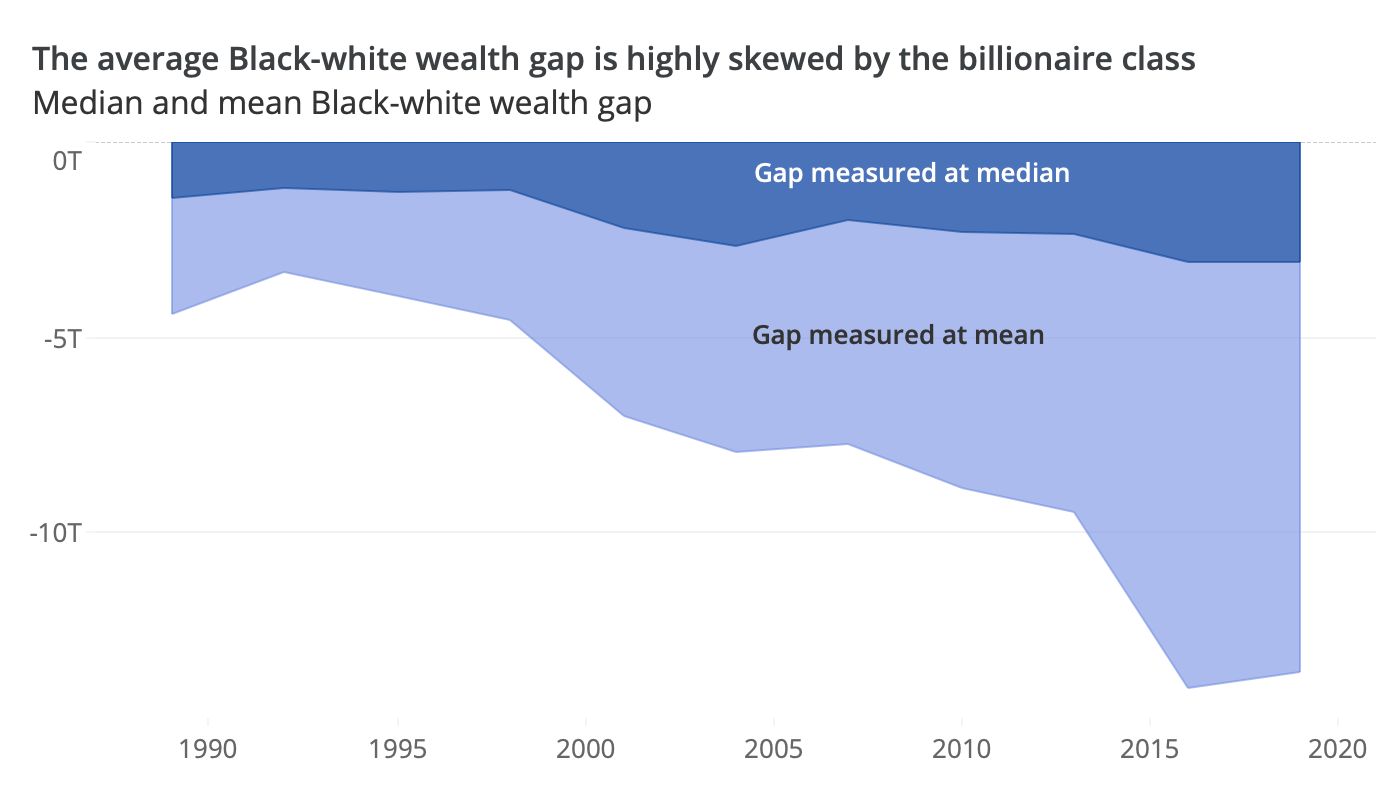
In 2019, more than 75% of the nation’s total wealth was held by the richest 10% of the population (and 50% of wealth was held by the top 2.3%). In order to paint a picture of the majority of the population and not have our analysis swayed by the extreme wealth of the nation’s billionaire class, we measured the median wealth gap, tallying what the total wealth difference would be if every household had the typical wealth for their race and age group.
The median wealth gap of $3 trillion presented here may seem small next to the average gap of $13.5 trillion (which includes billionaires), and the larger number is relevant when measuring the power of the nation’s ultra-rich to shape and defend institutions in ways that favor their interests. But it is less-relevant when examining the role of housing in accounting for typical wealth (housing is a fairly tiny share of your everyday billionaire’s overall portfolio), and there are vanishingly few Black billionaires to begin with — in 2020, just seven of the country’s 614 billionaires were Black.
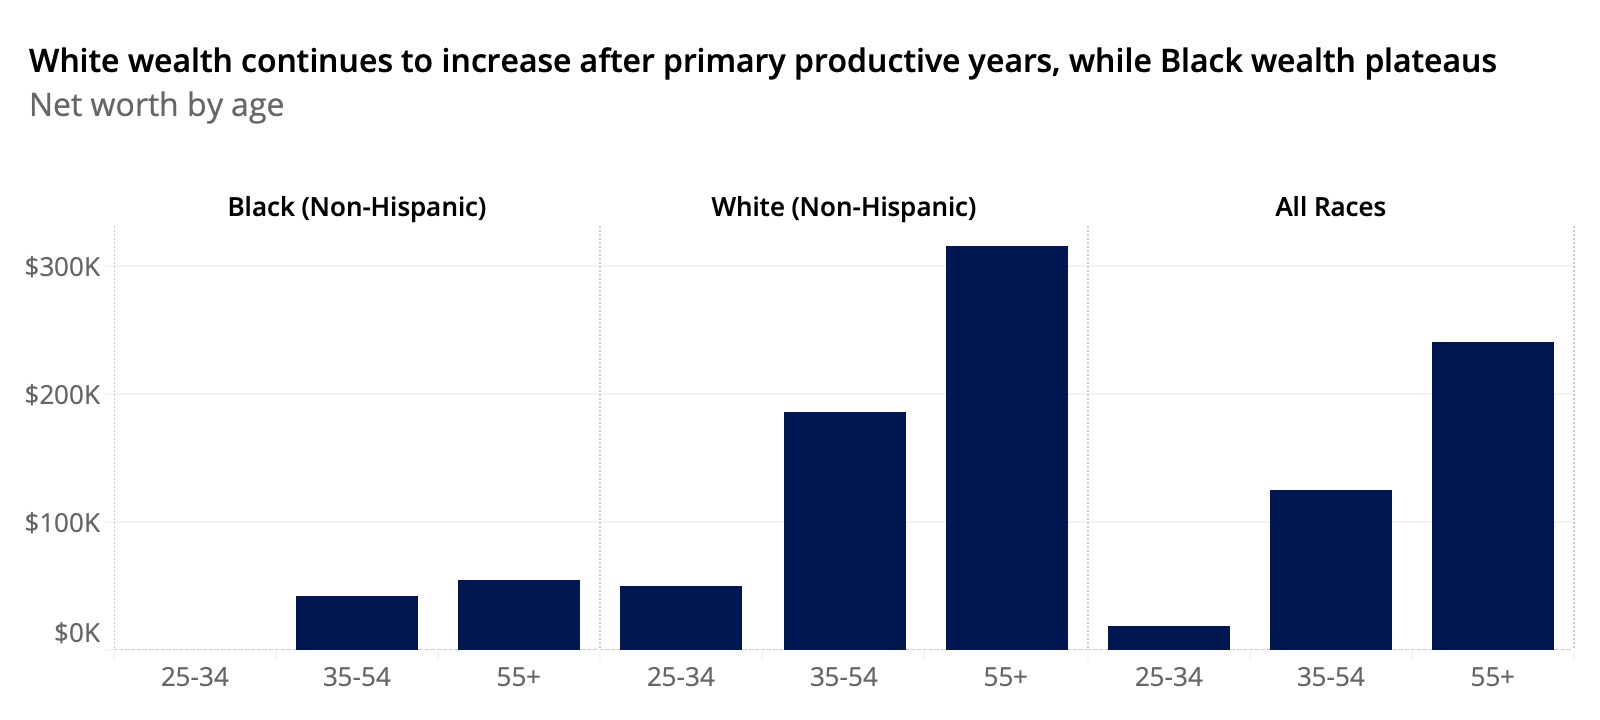
Not only is total wealth different across races, the timeline for accumulating wealth also varies widely. White wealth continues to increase after primary productive years (ages 55+, relative to ages 35-54), while Black wealth plateaus. This implies different assets and expenses, as well as different sources of assets in later life — for example, inheriting a home. For typical homeowners, their home is their single-largest asset and a major means of wealth generation and transfer. So the lower homeownership rate among Black households to begin with further contributes to cyclically depressing their wealth relative to whites.
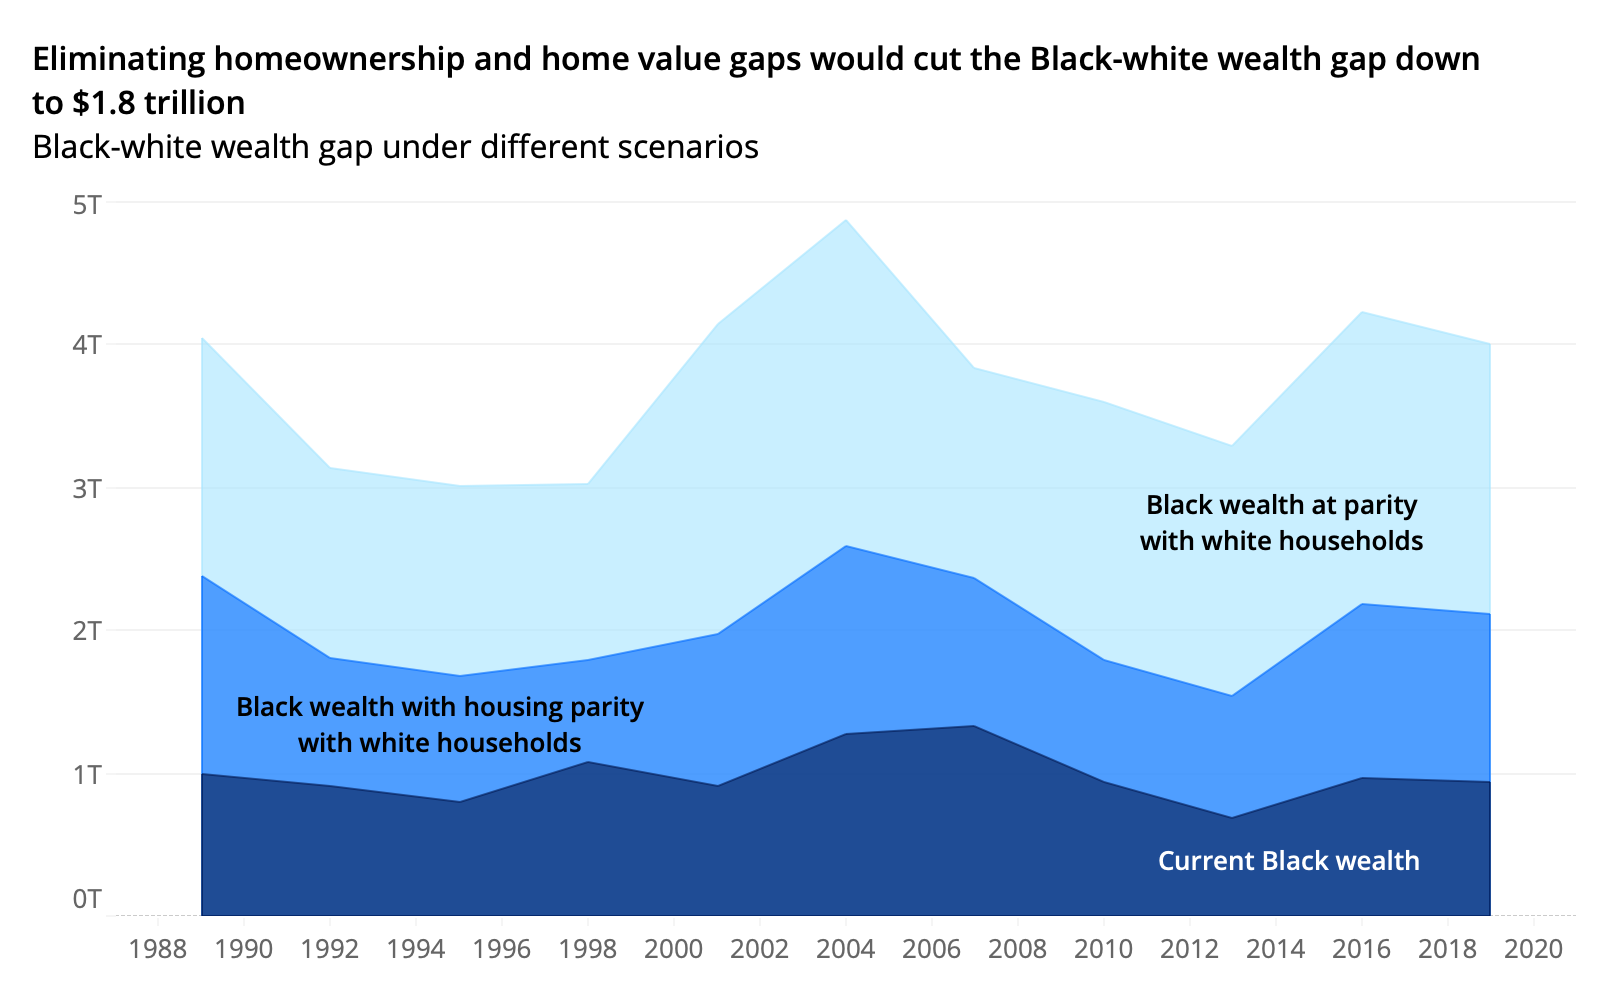
Almost 40% (38.4%, or $1.18 trillion) of the $3 trillion wealth gap can be directly attributed to homeownership rates and home values. Nationwide, Black-owned homes are typically worth about 18% less than white-owned homes, and the Black homeownership rate is just 42% — compared to 72% for white households. If Black housing in America looked like white housing, with comparable homeownership and home values, Black wealth would be more than double what it currently is ($2.1 trillion instead of $930 billion).
These differences in homeownership and home values contribute roughly equally to the housing portion of the overall Black-white wealth gap. If the typical Black home was worth the same as a typical white home, that would account for about half of the $1.18 trillion housing inequality portion of the overall wealth gap. All else equal, a five percentage point increase in the Black homeownership rate would translate into a $74 billion decrease in the wealth gap. And (again, all else equal) a 5% increase in Black home values relative to white home values translates to a $31 billion dollar decrease in the wealth gap. Together, eliminating these housing disparities would cut the wealth gap down to $1.8 trillion — still very wide (there are plenty of wealth inequities outside of housing), but the single-largest chunk would be eliminated.
Making Modest Progress
Highlighting only the current disparities should not detract entirely from modest progress made in recent years. The Black homeownership rate — which has essentially always been well-below the white rate — grew by about 1 percentage point between Q1 2019 and Q1 2020 (before the pandemic impacted data collection), while the white homeownership rate stayed flat over that period. And Black home values have grown about 1 percentage point faster per year for the last three years. So despite many other forces at work, these housing factors may be slowly helping to narrow the gap.
And the pandemic does not seem to have changed this trajectory, at least in terms of home values. In February 2020, just prior to the U.S. outbreak of the pandemic, Black home values were up 4.6% from February 2019, while white home values were up just 3.6%. A year later in February 2021, Black home values were up 10.9% year-over-year while white home values were up 9.7%, This faster appreciation among Black-owned homes narrowed the overall home value gap from 16.7% to 15.9% — the opposite of what happened during the last recession.
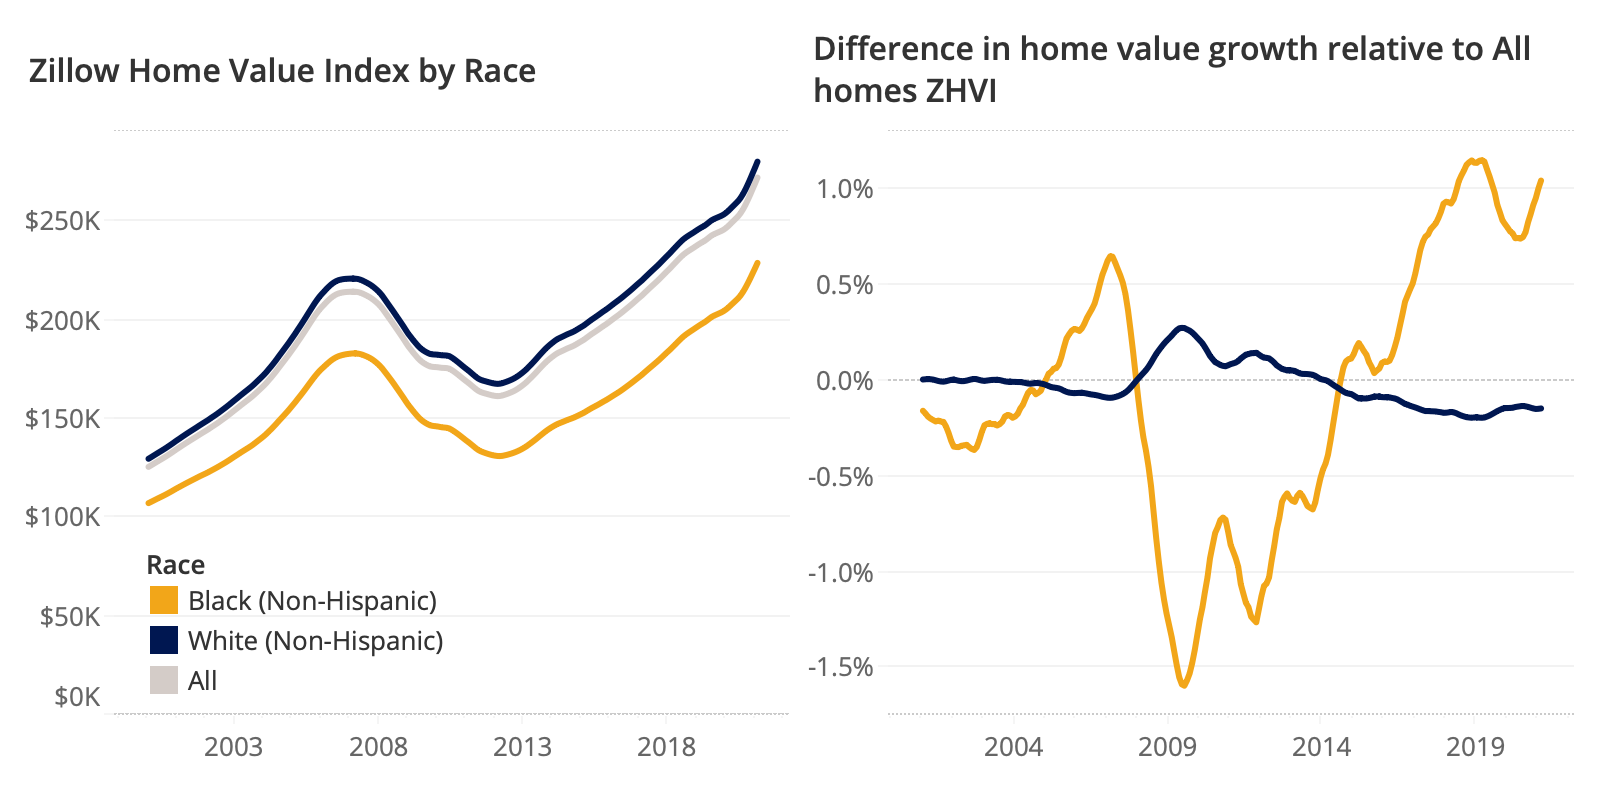
In December 2007, home values were falling at the same rate for Black and white households, both down 2.6% year-over-year. But by December 2008, Black home values were down 10.9%, compared to a smaller 9.5% decline in white home values — serving to widen the home value gap from 14.6% to 15.8%. And it only got worse from there over the next half decade. Still, going forward, even if Black home value appreciation slows somewhat from the current rapid pace, it seems unlikely that these recent modest gains will be reversed.
Assets & Liabilities
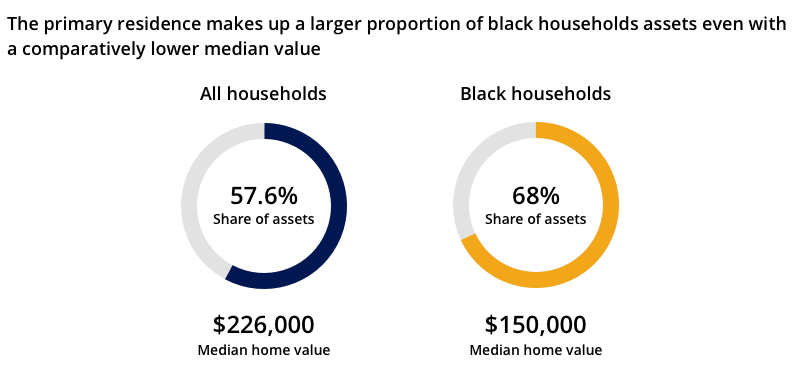
For all homeowners, their primary residence is typically their largest asset, with a median value (according to the 2019 SCF) of $226,000, representing 57.6% of all assets held, on average. For Black homeowners the primary residence is an even larger proportion of assets, representing 68.0% of total assets, on average, even with a comparatively lower median value of $150,000. The next largest asset is generally a retirement account, making up 13.4% of assets for all homeowners, but just 10.1% of Black homeowners’ assets.
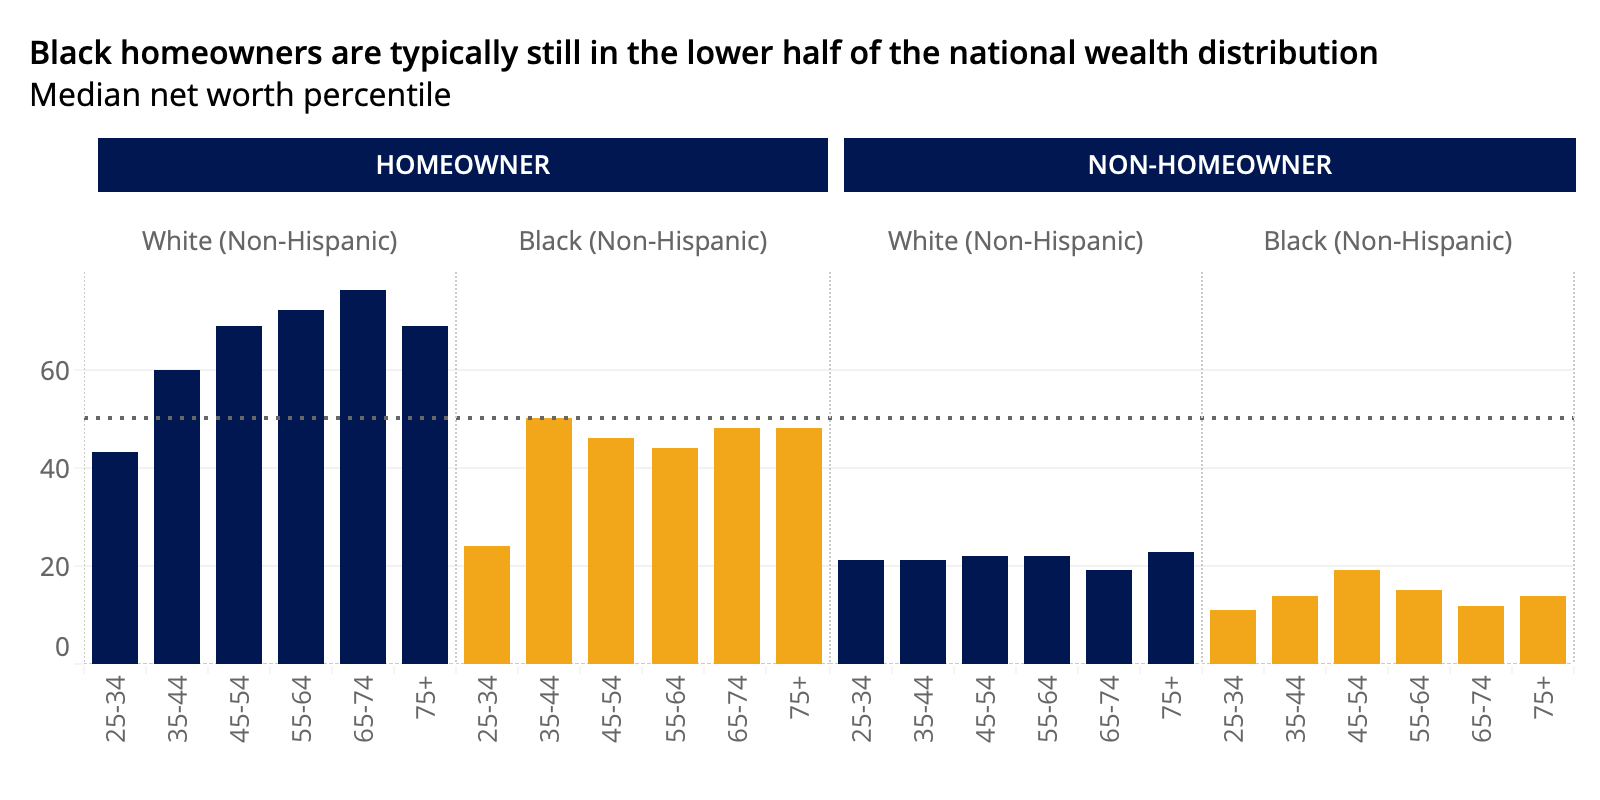
The primary residence is also typically the largest liability for homeowners, representing 64.1% of debts on average, with a median balance of $135,000. For Black homeowners, a mortgage on a primary residence accounts for 55.5% of debts on average, with a median balance of $117,814 — signifying that Black homeowners have other debts relative to housing, and demonstrating further that homeownership isn’t the end of the disparity. The result is that Black homeowners, despite owning a home, are typically still in the lower half of the national wealth distribution.
For renters, the largest asset tends to be the vehicle(s) followed by liquid bank accounts (checking/savings). These assets typically do not appreciate; their growth is tied to income rather than returns and in general the growth rate of non-housing assets, especially for renters, can be very low. Holding these growth rates constant to the 30-year average we can project the overall impact on wealth that would come from changes in the homeownership rate and home values over the next decade.
Charting the Next Decade
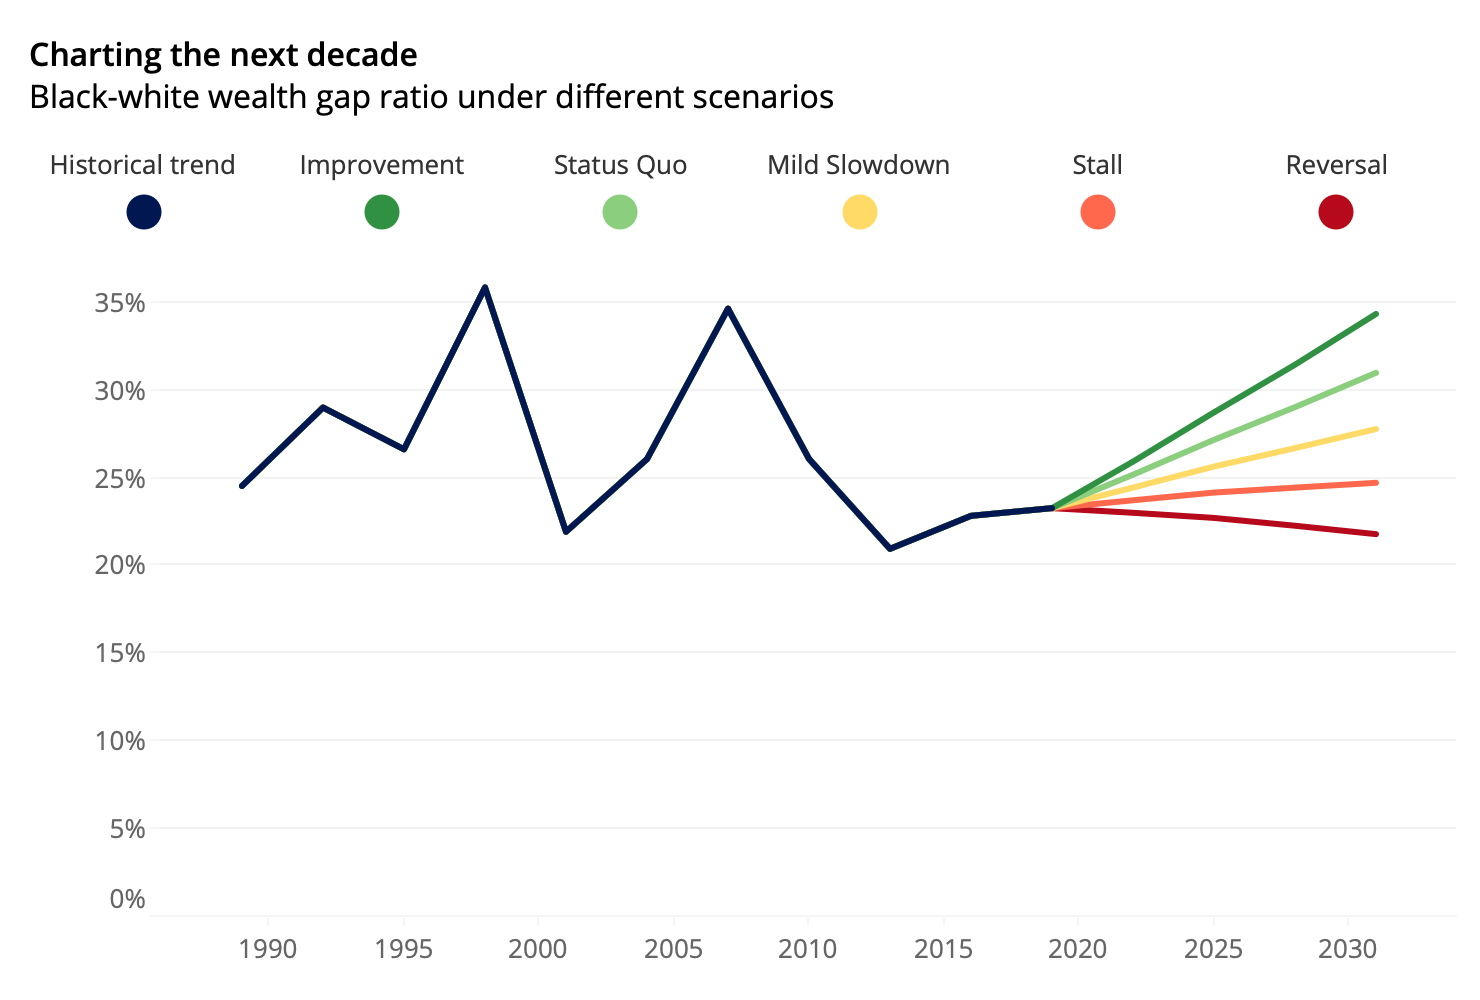
Housing will be a prominent factor determining the course of the racial wealth gap over the next decade. Homeownership changes and home value appreciation could, under certain circumstances, help grow Black wealth by more than half a trillion dollars, from $931 billion to $1.46 trillion by 2031 — or contribute to a slight decline in Black wealth to about $928 billion. In what is arguably the most likely scenario, housing gains will lead Black wealth to increase 25%-30% by 2031 (inflation-adjusted), to about $1.18 trillion. This would increase Black wealth relative to the white-equivalant from 23.3% to 27.8% (with scenarios ranging from 21.8% to 34.3%).
Here are five scenarios to consider, based on the current trajectory of Black housing:
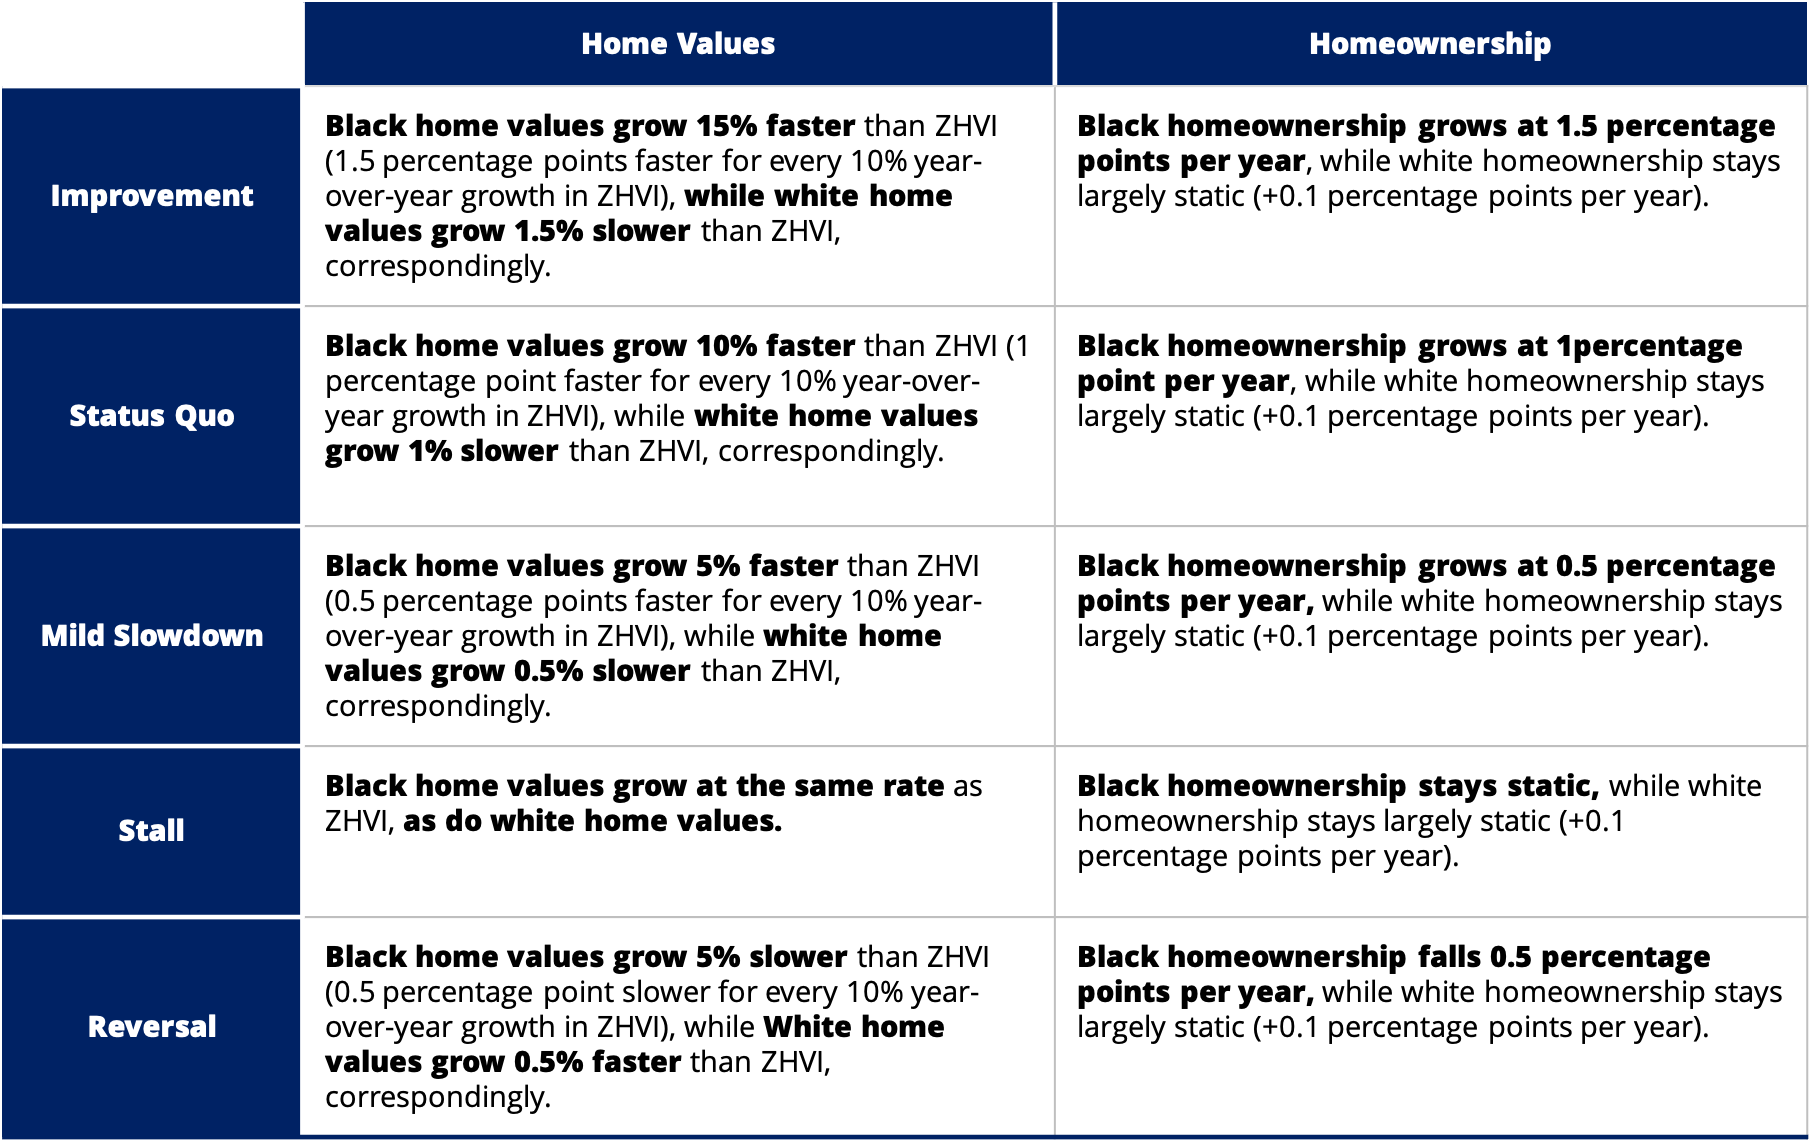
For several reasons, the “mild slowdown” scenario feels most likely. Recent strong gains in Black homeownership could be the beginning of a long-term trend. But it seems unlikely that Black renters will be in as strong a position to buy a home going forward relative to other groups — housing prices and mortgage rates are rising quickly, and the Black community was hit disproportionately harder by pandemic-related job losses, among other factors. That said, other market changes — including a push for more-equitable lending standards, a reduction in exclusionary zoning rules, and the growing prevalence of telework — could make buying a home more accessible.
For the home value growth piece of the equation, there are just not a lot of cases nationally where home value growth between races has diverged by more than 10% — aside from the Great Recession, when it occurred in a conspicuously bad way. In late-2017/early-2018, Black home values were growing at 7.8% annually relative to 6.5% for whites, a healthy gap, and while the relative rate is currently about 10%, preliminary forecasts show this falling to a more normal 5% over the coming year.
A Slow Path to Parity
That middle scenario is progress. It’s just that at that rate, it would take until 2183 to reach housing parity. No one alive today, or their children, would see an America with racial housing equality. But there are organizations that have targeted more aggressive change. A recent report from the National Community Reinvestment Coalition has called for a goal of 60% Black homeownership by 2040 — which would move the timeline for housing parity up to 2093. But it’s abundantly clear that this issue won’t solve itself naturally or quickly. The problems run deep and they feed back, perpetuating the inequality. Intentional, targeted and dedicated policy is necessary to repair this broken system. In the most optimistic scenario, the timeline for housing equality is moved up significantly to 2066. This would mean Black millennials could see housing equality in their retirement, and finally pass on some real wealth to the next generation.
METHODOLOGY
Sources
This analysis uses several sources in some capacity:
- Survey of Consumer Finances (SCF), Federal Reserve Board
- Zillow Home Value Index (ZHVI), with estimates by race, Zillow
- American Community Survey (ACS) 5-year estimates, Census Bureau (used in race component of ZHVI)
- Housing Vacancies and Homeownership Survey (CPS/HVS), Census Bureau
- Zillow Home Price Expectations Survey (ZHPE) First Quarter 2021, Zillow + Pulsenomics
- Consumer Price Index for All Urban Consumers: All Items (CPIAUCSL), Bureau of Labor Statistics
Wealth and the wealth gap
The SCF (1989-2019) summary microdata was used to generate estimates of the national level of wealth and composition of wealth by race. The sample was limited to economic units with the respondent (treated as household head) age 25 and greater. Total wealth was derived by first taking the median of wealth (NETWORTH) by race (RACECL4), ten-year age groups (and 75+), and homeownership status (HHOUSES). The population-weighted mean of subgroup medians was taken for each race and age group, combining homeowners and renters. The population-weighted mean of those age group means was taken for each race. This three-step process was used to: (1) to be consistent with wealth projections which are done at the level of subgroup medians and (2) to be able to standardize the wealth gap by age and not over-estimate the wealth gap because of the older white population. The wealth gap itself is the summed difference across age groups of Black net worth minus the white net worth equivalent. That is,
wealth gap =median black wealthage *# of black householdsage – median white wealthage *# of black householdsage
The role of housing
The housing portion of wealth was defined as the total value of primary and secondary homes (HOUSES+ORESRE) minus the total debt on those homes (MRTHEL+RESDBT). This was aggregated by the same subgroups as total wealth, and similarly compared across races. The gap considering only housing assets and liabilities was compared to the total gap to derive the housing share of the total gap. All dollar values were inflation adjusting to 2019 dollars using the Consumer Price Index for All Urban Consumers: All Items.
Projections
With the goal of determining the impact of housing on the evolution of the wealth gap, the growth rates of non-housing factors were held constant. Taking all non-housing assets together and liabilities together, we determine the average annualized rate of change by age group and homeownership status. This average rate was used to project forward from 2019 median non-housing assets and liabilities. The housing scenarios we considered varied homeownership and home value growth together as described above. Homeownership rate scenarios were based on the Q1 HVS homeownership rate by race and observing the history of rate changes. Relative home value growth was based on the distributions of relative home value growth by race in the ZHVI by race project (a multi-stage aggregation of zip code level home values, weighted by ACS owner-occupied housing units by race). These relative growth rate scenarios were applied to central growth rate expectations from 2021-Q1 ZHPE, a quarterly survey of over a hundred real estate experts in which respondents gave their home value growth expectations until the end of 2025. We extended these estimates to 2031 using the historical average growth rate of 3.6%. The resulting homeownership and home value growth were used to inflate median housing wealth. Housing and non-housing wealth were added to yield total wealth under different housing scenarios.